Gaphorisms: Guerrilla Aphorisms
Gaphorisms: Guerrilla Aphorisms
CaP bombs you can drop in team meetings or use as party favors
Updated on Jan 5, 2021
| The Guerrilla Manifesto |
| Management resists, the guerrilla analyst retreats. |
| Management dithers, the guerrilla analyst proposes. |
| Management relents, the guerrilla analyst promotes. |
| Management retreats, the guerrilla analyst pursues. |
- This online edition updates The Guerrilla Manual originally included as a pull-out booklet with the
initial printings of the
Guerrilla Capacity Planning book.
-
Spontaneous Gaphorism candidates also appear regulary on
Twitter.
Contents
1 WEAPONS OF MASS INSTRUCTION
1.1 Why Go Guerrilla?
1.2 Best Practices
1.3 Virtualization
1.4 Selling Prevention is Hard
1.5 Why is Performance Analysis Hard?
1.6 Brisk vs. Risk Management
1.7 Failing On Time
1.8 Performance Homunculus
1.9 Self Tuning Applications
1.10 Squeezing Capacity
1.11 When Wrong is Right
1.12 Throw More Hardware at It
1.13 Network Performance
1.14 Not even wrong!
1.15 Measurement vs. Models
1.16 Data Are Not Divine
1.17 Busy work
1.18 Little's Law
1.19 Bigger is Not Always Better
1.20 Bottlenecks
1.21 Benchmarks
1.22 Failure to Communicate
1.23 Consolidation
1.24 Control Freaks Unite!
1.25 Productivity
1.26 Art vs. Science
1.27 ITIL for Guerrillas
1.28 Performance Paradox
1.29 Dumb Questions
1.30 Quantum Leap
1.31 Don't Be a Sheeple
1.32 Good Communication
1.33 Performance Gatekeepers
1.34 Performance Analysis is a Money Sink
1.35 Tyranny of the 9s
1.36 Timescale Intuition
1.37 Throughput vs. Latency
1.38 The Zeroth Performance Metric
1.39 Only Three Performance Metric
1.40 IT is the Manufacturing Line of the 21st Century
1.41 Uncommon Sense
1.42 Don't Tell Stories
1.43 Performance is Not Engineering
1.44 It's Only Words
2 PERFORMANCE MODELING RULES OF THUMB
2.1 What is Performance Modeling?
2.2 Monitoring vs. Modeling
2.3 Keep It Simple
2.4 More Like The Map Than The Metro
2.5 The Big Picture
2.6 A Point of Principle
2.7 Guilt is Golden
2.8 What is a Queue?
2.9 Where to Start?
2.10 Inputs and Outputs
2.11 No Service, No Queues
2.12 Estimating Service Times
2.13 Change the Data
2.14 Closed or Open Queue?
2.15 Opening a Closed Queue
2.16 Steady-State Measurements
2.17 Transcribing Data
2.18 Workloads Come in Threes
2.19 Better Than a Crystal Ball
2.20 Patterns and Anti-Patterns
2.21 Interpreting Data
2.22 Intuition and Modeling
2.23 Load Average
2.24 VAMOOS Your Data Angst
2.25 All Measurements are Wrong
2.26 Modeling Errors
2.27 Data Ain't Information
2.28 Text is the Universal API
2.29 Play It Where It Lies
2.30 Data is Not Enough
2.31 Plans Are Useless
2.32 Benchmark Design
2.33 Waiting Time
2.34 Statistics
2.35 Realistic Models
2.36 Models as Explanations
3 UNIVERSAL SCALABILITY LAW (USL)
1 WEAPONS OF MASS INSTRUCTION
1.1 Why Go Guerrilla?
The planning horizon is now 3 months, thanks to the gnomes on Wall
Street. Only
Guerrilla-style
tactical planning is crazy enough to
be compatible with that kind of insanity.
1.2 Best Practices
Best practices are an admission of failure.
Mindlessly following the best practices defined by others is actually a
failure to understand your own particular requirements for performance and capacity.
If you don't understand your own particular performance and capacity problems,
why would you expect other people's practices (i.e, solutions) to be appropriate for you?
Copying someone else's apparent success is like cheating on a test.
You may be lucky and make the grade this time, but will that bluff still work in the future?
Best practices are like most rules of thumb: over time, they R O T.
A recent NPR program discussed how applying best practices has backfired in the arena of medicine and healthcare.
This analogy is very appropriate because many aspects of performance analysis are not too different from the
science of medical diagnosis. See the section on
The Limits Of Best Practices (NPR Sept 21, 2011).
In the context of software performance engineering,
see "10 Practices of Highly Ineffective Software Developers."
I would also add the following (based on my own experience):
11. Avoid acceptance testing like the plague.
12. Develop on a platform totally unrelated to the production system.
13. Never compare load test requirements and results with actual remote user-based measurements from Keynote, Gomez, etc.
1.3 Virtualization
All virtualization is about illusions and
Voltaire said:
"Illusion is the first of all pleasures."
However, when it comes to IT, even if it provides a more pleasurable experience to
perpetrate illusions onto a user, it is not ok to foist them on the performance analyst or capacity planner.
Translation: We performance weenies need more whistles and less bells.
In other words, virtualization vendors need to make sure they provide us with backdoors and peepholes so we
can measure how resources are actually being consumed in a virtualized environment.
Corollary: Can you say, transparency?
It's better for the IT support of business if we can manage it properly.
To manage it, it can't be illusory.
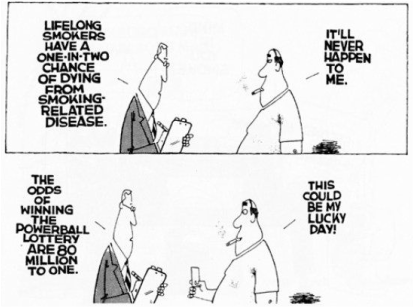
1.4 Selling Prevention is Hard
Capacity and performance management is largely about prevention and someone once told me, "You can't sell prevention."
To which my retort was, "Then, explain the multi-billion dollar dietary-supplements industry?"
Nonetheless, there is an annoying truth to the original statement. It can be very hard to make future risk appear relevant in the here and now.
Recent studies also suggest that it may be harder to sell prevention in English.
The more clearly a language distinguishes the future (tense), the less likely the speaker is to feel
threatened by what will happen there. Roughly put: if it's not happening to me now, it won't ever happen to me.
Ultimately, it's not what you sell, but how you sell it.
See also Section 1.22 on presentations.
1.5 Why is Performance Analysis Hard?
Both performance analysis and capacity planning are complicated by your brain thinking linearly
about a computer system that operates nonlinearly.
Looked at another way, collecting and analyzing performance metrics is very important, but understanding
the relationship between those metrics is vital. Reason? Those metric relationships are
nonlinear. That's why we rely on tools like
queueing models
and the universal scalability law.
They encode the correct nonlinearities for us.
1.6 Brisk vs. Risk Management
BRisk management, isn't.
Perceived risk (psychology) and managed risk (analysis) are not the same thing.
 Here's an actual example of (mis)perceived risk:
"I can understand people being worked up about safety and quality with
the welds," said Steve Heminger, executive director ... "But we're
concerned about being on schedule because we are racing against the next
earthquake."
This is a direct quote from a
Caltrans executive manager for the
new Bay Bridge
construction between Oakland and San Francisco. He is saying that Caltrans management decided to ignore
the independent consultant analysis of the welding quality in order to stay on schedule. Yikes! See mantra 1.7.
Although he is not an IT manager, the point about BRisk management is the same.
You can read more background on this topic on
my blog.
1.7 Failing On Time
Management will often let a project fail—as long as it fails on time!
Until you read and heed this statement, you will probably have a very frustrating time getting your performance analysis conclusions
across to management.
Here's an example of "fail on time" management that comes from outside the IT industry but, succinctly captures the essence of the situation.
A portion of the upper deck of the Oakland-San Francisco Bay Bridge
collapsed during the 1989 Loma Prieta earthquake.
The old bridge has now been replaced by the California Department of Transportation (Caltrans) with a new suspension bridge.
During the construction of the new bridge, a Caltrans manager, who was focused on the contract schedule,
concluded that it was better to increase the risk that the
new bridge
could fail by hurriedly inspecting its welded sections in order to "beat" the much lower hypothetical risk that the old
bridge would totally collapse if another earthquake struck in the meantime.
This is a classic example of project management logic. Decisions made on the basis of
Gantt charts
without any quantitative analysis of the real and implied risks.
Substitute your favorite IT project for the word bridge and you get the idea.
Update: As of May 2013 the original high-risk Caltrans decision has prompted
Gov. Jerry Brown
to threaten delaying the scheduled Labor Day opening of the new Bay Bridge span.
Erm... so, how did this brisk management decision save time (and money)?
Update: On September 2, 2013, the new East Span of the San Francisco-Oakland Bay Bridge opened
on schedule to traffic.
Update: May 16, 2014.
Caltrans acknowledges
that it could take months and millions of dollars to fix problems.
Again. How did the preceding brisk management decision save time and money?
Update: May 6, 2015.
Bay Bridge ``Project From Hell'' Develops New Problem
There appears to be a new problem with the new eastern span of the Bay Bridge, so bad that the Executive Director of the
Metropolitan Transportation Commission Steve Heminger said Wednesday, "This is the project from Hell."
Update: June 4, 2015.
Corrosive salty water threatens 120 Bay Bridge anchor rods
Caltrans' chief bridge engineer on the project, Brian Maroney, said Thursday that the cost of testing the foundation and the rods could end up being as much as
$10 million. The project is running about $50 million in the red.
See mantra 1.6, about RISK management.
1.8 Performance Homunculus
A list of system management activities might include such things as:
- Security management
- Software distribution
- Backup management
- Chargeback management
- Cap and Perf management
Of these, all but capacity management has some kind of shrink-wrap or COTS solution.
Capacity and performance management cannot be treated as just another bullet item on a list of things to do.
Cap and Perf management is to systems management as the
homunculus
(sensory proportion) is to the human body (geometric proportion).
Cap and Perf management can rightly be regarded as just a subset of
systems management, but the infrastructure requirements for successful
capacity planning (both the tools and knowledgeable humans to use them)
are necessarily out of proportion with the requirements for simpler systems
management tasks like software distribution, security, backup, etc. It's
self-defeating to try doing capacity planning on the cheap.
1.9 Self Tuning Applications
Self-tuning applications are not ready for prime time.
How can they be when human performance experts get it wrong all the time!?
Think about it.
Performance analysis is a lot like a medical examination, and
medical Expert Systems were heavily touted in the mid 1980's.
You don't hear about them anymore. And you know that if it worked,
HMO's would be all over it.
It's a laudable goal but if you lose your job, it won't be because of
some expert performance robot.
1.10 Squeezing Capacity
Capacity planning is not just about the future anymore.
Today, there
is a serious need to squeeze more out of your current capital equipment.
1.11 When Wrong is Right
Capacity planning is about setting expectations. Even wrong expectations are better than no expectations!
Or, as the (oft misquoted) Cheshire cat said:
"If you don't know where you are going, any road will get you there."
The planning part of capacity planning requires making predictions. Even a wrong prediction is
useful because it can serve as a warning.
Either:
- the understanding that underlies your predictive model is wrong
- wrong data is subverting your predictions (GIGO)
Either way, something needs to be corrected, but you wouldn't realize that without making a prediction in the first place.
If you aren't iteratively correcting predictions throughout a project
life-cycle, you will only know things are amiss when it's too late! GCaP says you can do better than that.
1.12 Throw More Hardware at It
The classic over-engineering gotcha. Hardware is certainly cheaper today, but a boat-load of cheap PCs from China
won't help one iota if the application runs
single-threaded.

Single-threadedness can wreck you
This is now my canonical response to the oft-heard platitude: "We don't
need no stinkin' capacity planning, we'll just throw more hardware at it."
The capacity part is easy. It's the planning part that requires
brain power.
1.13 Network Performance
It's never the network ... except when it is.

If your local network is out of bandwidth, has interminable latencies, or is otherwise glitching, don't bitch
about the performance of your application. Get the network fixed first, and then we'll talk about the performance of your application.
1.14 Not even wrong!
Here is a plot of round-trip times ("Median RTT") measured by a performance engineer
for a set of applications as a function of increasing user load ("Clients").
Take a good, long look. If your application has concave response times like these, ship it!
 In case you're wondering, those are real data and yes, the axes are labeled correctly.
I'll let you ponder what's wrong with these measurements.
Here's a hint: they're so broken, they're not even wrong!
Only if you don't understand basic
queueing theory,
could you possibly accept measurements like these; which the original performance engineer did.
In case you're wondering, those are real data and yes, the axes are labeled correctly.
I'll let you ponder what's wrong with these measurements.
Here's a hint: they're so broken, they're not even wrong!
Only if you don't understand basic
queueing theory,
could you possibly accept measurements like these; which the original performance engineer did.
1.15 Measurement vs. Models
When I'm asked, "But, how accurate are your performance models?" my
canonical response is, "Well, how accurate are your performance data?"
Most people remain blissfully unaware of the fact that all
measurements come with errors; both systematic and random. An important
performance analysis task is to determine (and track) the magnitude of the
errors in your performance data.
Every performance datum should come with a `±' attached, which would force a number to appear after it,
e.g., 136 ± 16.
Obviously, this would take more space, but there are ways around that issue, e.g., display on mouseover.
No commercial or open source performance tools, that I am aware of, do anything like this.
Example:
Suppose you measured the following network ping latencies in milliseconds:
> rt.ms
[1]  92 120 172 162 178  93
The average time is given by
> mean(rt.ms)
[1] 136.1667
The error can be expressed using the standard deviation
divided by the square root of the number of measurements
> sd(rt.ms)/sqrt(length(rt.ms))
[1] 16.10055
This number is called the standard error.
We need to round these calculated values since we didn't have any decimal digits in the original
measurements and we can't have more precision than the least precise datum.
The final result is expressed as
136 ± 16 ms, which means that a new
measurement is expected to fall anywhere between 120 ms and 152 ms.
This represents about 12% error in the measurements.
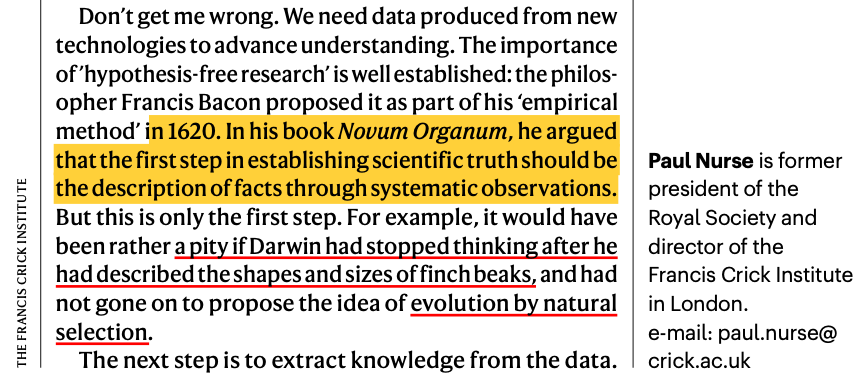
1.16 Data Are Not Divine
Treating performance data as something divine is a sin.

Charlton Heston laying down the laws of queueing theory (Erlang was just a fame bot)
Data comes from the Devil, only models come from God.
Corollary:
That means it's helpful to be able to talk to God. But God, she does babel, sometimes. :)
Darwin's theory of evolution by natural selection is another example of a model that has its origins
firmly planted in data collection.
 Also check out these related points:
1.15 Measurement Error
2.13 Change the Data
2.25 Measurement Errors
2.30 Data is not enough
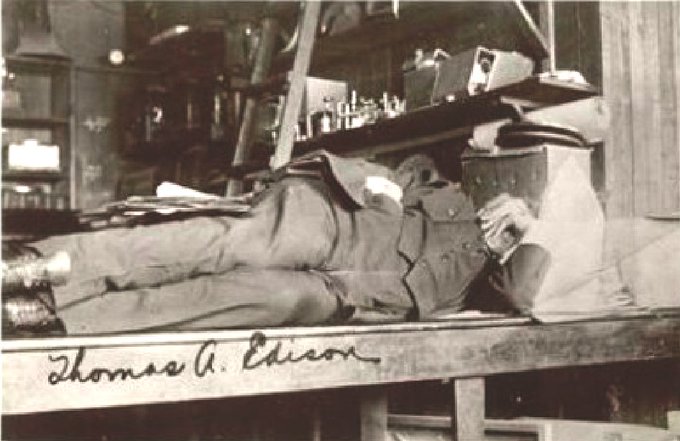
1.17 Busy work
Just because you're busy doesn't mean you're actually achieving anything.
Or, as Thomas Edison said:
"Seeming to do is not doing."
Many cultures tend to glorify the hours clocked as being equivalent to productive work.
However, if you don't take time out to reflect on what you're
actually doing, how are you going to know when what you're doing is wrong?
Similarly for the value of work:
Nikola Tesla visited Henry Ford at his factory, which was having some kind of
difficulty. Ford asked Tesla if he could help identify the problem area. Tesla
walked up to a wall of boilerplate and made a small 'x' in chalk on one of the
plates. Ford was thrilled, and told him to send an invoice. The bill arrived,
for $10,000. Ford asked for a breakdown. Tesla sent another invoice, indicating
a $1 charge for marking the wall with an 'x', and $9,999 for knowing where to put
it.
See also, W. Edwards Deming and
The Improvement Paradox
— Too Busy To Improve?
1.18 Little's Law
Little's law means a lot!
I must say I don't like the notation on that Wikipedia but, more importantly,
Wikipedia fails to point out that there are really two versions of Little's law. (Even John Little doesn't know that.)
- Little's BIG law:
which relates the average queue length (Q) to the residence time R = W + S.
Here, W is the average time you spend waiting in line to get your groceries rung up, for example,
and S is the average service time it takes to ring up your groceries once you get to the cashier.
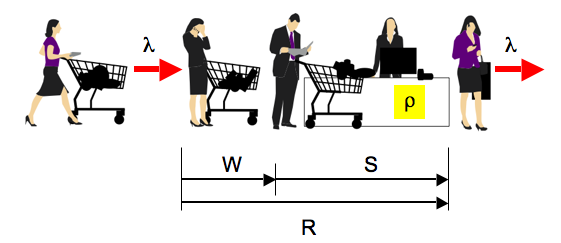
- Little's little law:
which often goes by the name Utilization law.
It relates the average utilization (ρ), e.g., of the cashier, to the service time (S).
Equation (2) is derived from (1) by simply setting W = 0 on the right-hand side of the equation.
In both equations, the left-hand side is a pure number, i.e., it has no formal units (% is not a unit).
It is important to realize that eqns.(1) and (2) are really variants of the same law: Little's law.
Here's why:
- Eqn.(1) tells us the average number of customers or requests in residence.
- Eqn.(2) tells us the average number of customers or requests in service.
That second interpretation of utilization can be very important for performance analysis but
is often missed in textbooks and elsewhere (including Wikipedia pages).
You should learn Little's law (both versions) by heart.
I use it almost daily as a cross-check to verify that throughput and
delay values are consistent, no matter whether those values come from
measurements or models. Another use of Little's law is calculating service times, which are
notoriously difficult to measure directly.
If you know the values of ρ (utilization) and λ (throughput), you can calculate S (service time)
using eqn.(2).
More details about Little's law can be found in
Analyzing Computer System Performance with Perl::PDQ.
See also Mantras 2.10 and 2.12.
Finally, here's the lore behind Little's Law.
1.19 Bigger is Not Always Better
Mind the multicore wall !!!
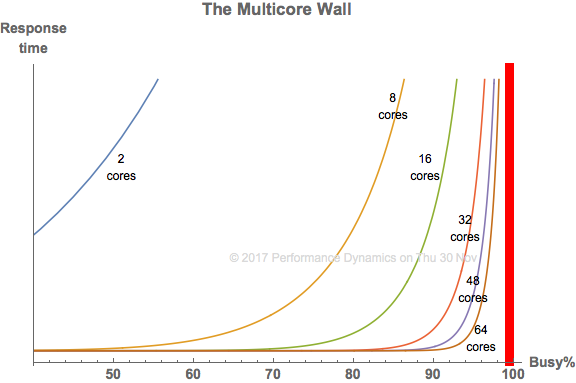
This plot was improved after a suggestion by Guerrilla grad Mohit Chawla
(@a1cy)
The bigger your multicore configuration, the busier you need to make all those cores.
Otherwise, you'll have a lot of wasted CPU capacity.
But you should only run them up to the
point where the run-queue suddenly begins to grow: the multicore wall.
Any busier and the application response time will suddenly start to skyrocket.
Users generally don't like that and may defect.
And because you are going to ask ... There is no meaningful, mathematically definable, "knee" point
in the above curves that can help you decide where to put the proverbial brakes on.
That's what
SLAs
are for.
The apparent knees are merely an optical illusion due to the default aspect ratio for the plot axes.
See Watch Your Knees and Queues
for more details.
1.20 Bottlenecks
You never remove a bottleneck, you only move it.
In any collection of processes (whether manufacturing or computing)
the bottleneck is the process with the longest
service demand.
In any set of processes with inhomogeneous service time requirements,
one of them will require the maximum service demand. That's the
bottleneck. If you reduce that service demand (e.g., via performance tuning),
then another process will have the new maximum service demand.
These are sometimes referred to as the primary and the secondary bottlenecks.
The performance tuning effort has simply re-ranked the bottleneck.
For an even deeper perspective, see my blog post:
Characterizing Performance Bottlenecks.
1.21 Benchmarks
All competitive benchmarking is institutionalized cheating.
The purpose of competitively benchmarking a computer system is to beat the competition based on some predefined performance metric, e.g. throughput or response time.
Then, the vendor can make a "mine is bigger than yours" claim. It's a zero-sum game that is otherwise the IT equivalent of war!
Here, competitive refers to benchmarks used by vendors, as opposed to benchmarking that you might do for purely internal comparisons
or diagnostic purposes.
Well-designed benchmarks should always come with rules for setting up and running the benchmark workload.
Those rules are intended to level the playing field amongst vendors and make the performance results more comparable for you, the evaluator.
But rules were made to be broken (or bent), especially in warfare—just don't get caught.
And how might a vendor get caught? Industrial-strength benchmarks that are designed by organizations like
SPEC.org
and TPC.org
have technical review committees that scrutinize all vendor-submitted benchmark results for cheating, as well as any unintended corner-cutting.
If any violations are found to be serious enough, vendors may be forced into resubmitting their results or withdrawing them entirely.
Because of the many opportunities for cheating, benchmark "cops" are a necessary part of the game.
Any competitive benchmark that does not require official auditing (the polite term) is not worth the code it's written in.
Another form of cheating is where a vendor defines and runs their own benchmark based on the rationale that "we know best how to demonstrate our performance."
This stance is analogous to proprietary vs. public software.
Such clandestine benchmarks are guaranteed to make the vendor king of the performance hill since, (i) by definition there can be no other vendor to compare against,
and (ii) there is no way to scrutinize how the benchmark was designed to favor that particular vendor. Since they're clandestine, all such benchmarks can promptly be ignored.
In fact, that's why organizations like, the
Standard Performance Evaluation Corporation, the
Transaction Processing Performance Council and the
Storage Performance Council, although highly imperfect, were formed in the first place.
All this skulduggery, however, doesn't mean that competitive benchmarks are completely useless. Far from it.
Such performance information may be the only data publicly available and can therefore be used by you for comparative
system sizing and capacity planning estimates. You just need to be aware of the assumptions and loopholes in published benchmark results and adjust accordingly.
I show you how to use competitive benchmark data (along with some personal benchmarking war-stories) in my
Guerrilla Capacity Planning class.
1.22 Failure to Communicate
"What we have here is failure to communicate." —Prison warden in the movie Cool Hand Luke.

The purpose of presenting your performance analysis or capacity plan is to communicate your findings.
No doubt, it takes a long time to do the analysis correctly. So, the last thing you want is a presentation FAIL.
- Question:
- How long should you spend creating your presentation?
- RoT:
-
Spend as much time developing your presentation
as did developing your analysis.
If your audience is missing the point, or you don't really have one because you didn't spend enough time developing it,
you just wasted a lot more than the time allotted for your presentation.
That it takes time—a lot of time—to hone your point, is captured
nicely in the following quote due to a famous French mathematician:
"Je n'ai fait celle-ci plus longue que parce que je n'ai pas eu le loisir de la faire plus courte."
—Blaise Pascal (Dec 4, 1656).
Translation: I have made it [this letter] longer because I have not had time to make it shorter.
Part of the reason W. Edwards Deming
(the father of Statistical Process Control)
may not have been well received in 1950s USA, is that his
communication style
was obscure to managers looking for a quick fix.
To further complicate matters, Deming frequently used language that left
executives scratching their heads. He began one presentation to corporate
managers with the question, "Do you have a constancy of purpose?"
1.23 Consolidation
Guerrilla law of consolidation: Remove it and they will come!
When consolidating applications, it's not the migration that's the problem,
it's the often mistaken motivation. The fallacious reasoning goes like this. Since there are a slew of servers
that are only running at 10% busy, migrate those apps onto fewer (virtualized) servers. Naturally, the
target server capacity will be better utilized but the application response time (SLA) has now gone out the window.
When you remove the necessary MIPS, the users will come ... and complain.
1.24 Control Freaks Unite!
Your own applications are the last refuge of performance engineering.
Control over the performance of hardware resources e.g., CPUs and
disks, is progressively being eroded as these things simply become
commodity black boxes viz., multicore processors and disk arrays. This
situation will only be exacerbated with the advent of Internet-based
application services. Software developers will therefore have to
understand more about the performance and capacity planning implications
of their designs running on these black boxes.
(See Sect. 3)
1.25 Productivity
if you want to be more productive, go to sleep.
Thanks to the Puritans, presumably, American corporate culture is
obsessed with the false notion that being busy is being productive. Wrong!
Europeans (especially the Mediterraneans) understand the
power of the cat nap. After nearly 400 years, it's time for America to get over it.
Creativity is the residue of wasted time. —A. Einstein
Who works the longest hours?
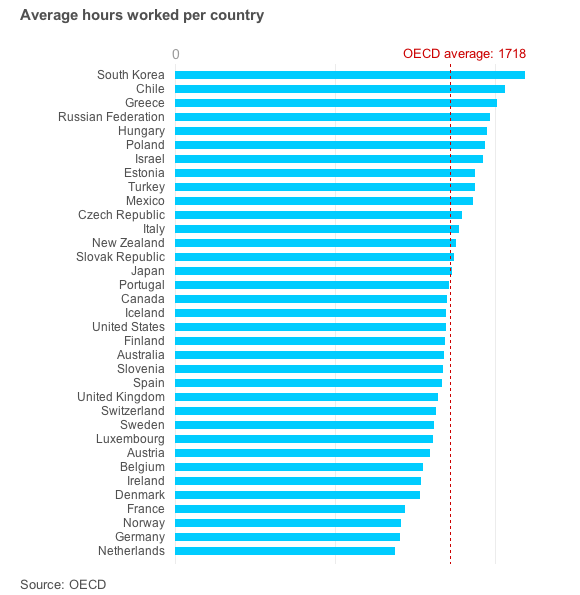
Data come from the OECD (Organization for Economic Co-operation and Development).
Developing countries often work longer hours, but working longer doesn't necessarily mean working better.
Interestingly, the USA is in the middle along with Australia.
1.26 Art vs. Science
When it comes to the art of performance analysis and capacity planning, the art is in the science.
A number of recent books and presentations
on performance analysis and capacity planning have appeared with "The Art of..."
in the title.
In itself, this is not new. The title of Raj Jain's excellent 1991 book is
The Art of Computer Systems Performance Analysis.
Nonetheless, they all resort to various scientific techniques to analyze performance data.
The application of science inevitably involves some art.
1.27 ITIL for Guerrillas
Question: What goes in the ITIL Capacity Management box?
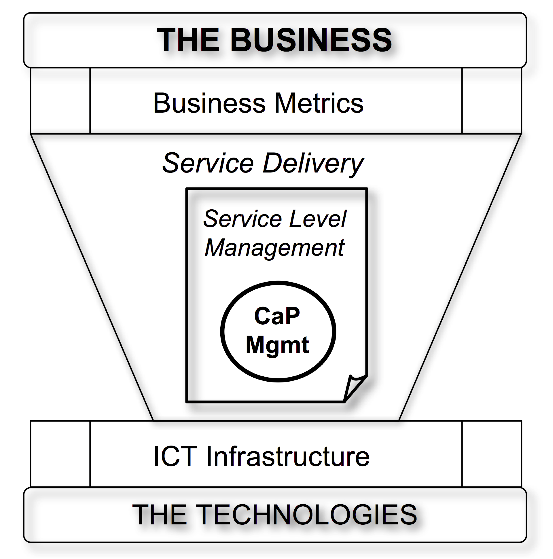
Source: Guerrilla Capacity Planning (Springer 2007)
Answer: GCaP fits the Capacity Management box.
The ITIL framework is all about defining IT processes to satisfy
business needs, not the implementation of those processes. That's what makes
Guerrilla Capacity Planning (GCaP) and
GCaP training
excellent ITIL business solutions.
1.28 Performance Paradox
Almost by definition, performance management contains a hidden paradox:
If you do performance management perfectly, you run the risk of becoming
invisible and therefore expendable to management.
—N. J. Gunther, "No Analysis Required! The Performance Analyst's Paradox," IEEE GRID, p.21, (Nov 1996)
In other words, having successfully supported performance management,
a manager could eventually feel justified in asking:
"Why is my budget paying for performance management when everything is performing perfectly?"
(read: career-limiting). On the other hand, if performance sucks, that's a performance management
problem. Moral: Perfect is not a requirement.
Compare this situation with software development. If a developer does their job
perfectly, they risk being overburdened with more work than they can handle
(read: job security).
If the application breaks, that's a software development problem (read: job security).
1.29 Dumb Questions
The only dumb question is the one you never ask.
 In some circumstances, however, it may take more than the usual amount courage to open your mouth.
But, rest assured this is never the case in
Guerrilla training classes.
In some circumstances, however, it may take more than the usual amount courage to open your mouth.
But, rest assured this is never the case in
Guerrilla training classes.
1.30 Quantum Leap
A quantum leap is neither. It can't be both quantal (the correct adjective) and a leap.
So, it's an oxymoron.
If it were quantal, it would be infinitesimally tiny (say, on the order of 10−10 meters)
and therefore not observable as a "leap" by us. Thus, it would be entirely unimpressive and not
worth mentioning as a clever-sounding phrase.
Conversely, if the leap were of the regularly observable variety,
it could not have an infinitesimally small quantal magnitude.
Quantum transitions in energy are only associated with the discrete spectrum of
atomic or molecular
bound states.
The intended notion being implied by the use of the deep-sounding adjective
"quantum" is that of a discontinuous transition or jump rather than a
transition of the continuous variety.
But discontinuous jumps occur all the time at greater than quantal scale, e.g.,
an earthquake can be one helluva jump. Not to mention the
discrete voltage jumps representing 1s and 0s in digital computers that
facilitate your reading this web page.
Try to avoid communication nonsensica (GMantra 1.31).
1.31 Don't Be a Sheeple
People who follow "Thought leaders" presumably have the intellect of Orwellian lemmings.
 Think for yourself and think critically about what other people tell you (including me).
1.32 Good Communication
Quantum leap (GMantra 1.30) is right up there with other moronic phrases like "sea change" (what IS that?) and
"moving forward"—who draws attention to moving backwards?
That last one was tweeted and ended up as entry #136 in David Pogue's
Twitter Book:

My most recent favorite is this one.
WAYNE SWAN (politician):
``I will not rule anything in or rule anything out.''
Ruling out, I get: take a ruler and draw a line through it. But how do you rule something in!?
And Mr. Swan didn't invent it. He's just mindlessly repeating it because he heard other boffins say it,
and I'm quoting him because it was captured in a transcript. (Double jeopardy)
 Good communication, which is vital for good performance analysis and capacity planning, requires that
you be a
shepherd, not a
sheeple.
Don't use nonsensical phrases just because everyone else does.
Besides, it makes you sound like an idiot ... or worse: a politician.
Good communication, which is vital for good performance analysis and capacity planning, requires that
you be a
shepherd, not a
sheeple.
Don't use nonsensical phrases just because everyone else does.
Besides, it makes you sound like an idiot ... or worse: a politician.
1.33 Performance Gatekeepers
Performance analysis is too complex and important to be left to enthusiastic individuals.
Performance specialists should act as gatekeepers.
A common situation in big organizations is for various groups to be responsible for the performance evaluation of
the software or hardware widgets they create. In principle, this is a good thing, but there is a downside.
Overly zealous attempts at LOCAL performance optimization of any subsystems in the stack
will almost inevitably detune the GLOBAL optimization of the entire system.
To avoid this side-effect, a separate central group should be responsible for oversight of total system performance.
They should act as both reviewers and gatekeepers for the performance analyses produced by all the other groups in the
organization.
1.34 Performance Analysis is a Money Sink
There is a serious misconception that precautions like
security management are part of the cost of doing business, but performance analysis actually costs business.
In other words, performance anything is perceived as a cost center, or money down the drain.

Remember the
performance homunculus in Section 1.8.
Unfortunately, there is some justification for this view. Performance activities like:
- Performance evaluation
- Performance by design
- Performance engineering
- Performance testing
can be seen as inflating schedules and therefore delaying expected revenue. See section 1.7.
Moreover, there can be an incentive to charge for the "performance upgrade" further down the line.
Better to be aware of these perceptions than be left wondering why your performance initiatives are
not being well received by management.
1.35 Tyranny of the 9s
You've no doubt heard of the
Tyranny of the 9s,
but how about subjugation to the sigmas?
| Nines | Percent | Downtime/Year | σ Level |
| 4 | 99.99% | 52.596 minutes | 4σ |
| 5 | 99.999% | 5.2596 minutes | - |
| 6 | 99.9999% | 31.5576 seconds | 5σ |
| 7 | 99.99999% | 3.15576 seconds | - |
| 8 | 99.999999% | 315.6 milliseconds | 6σ |
The following R function will do the calculations for you.
downt <- function(nines,tunit=c('s','m','h')) {
	ds <- 10^(-nines) * 365.25*24*60*60
	if(tunit == 's') { ts <- 1; tu <- "seconds" }
	if(tunit == 'm') { ts <- 60; tu <- "minutes" }
	if(tunit == 'h') { ts <- 3600; tu <- "hours" }
	return(sprintf("Downtime per year at %d nines: %g %s", nines, ds/ts,tu))
}

> downt(5,'m')
[1] "Downtime per year at 5 nines: 5.2596 minutes"
> downt(8,'s')
[1] "Downtime per year at 8 nines: 0.315576 seconds"
6σ is the "black belt" level that many companies
aspire to. The associated σ levels correspond to the area contained under the standard normal (or "bell shaped") curve
within that σ interval about the mean. It can be computed using the following R function:
library(NORMT3)
sigp <- function(sigma) {
	sigma <- as.integer(sigma)
	apc <- erf(sigma/sqrt(2))
	return(sprintf("%d-sigma bell area: %10.8f%%; Prob(chance): %e",
		sigma, apc*100, 1-apc))
}

> sigp(2)
[1] "2-sigma bell area: 95.44997361%; Prob(chance): 4.550026e-02"
> sigp(5)
[1] "5-sigma bell area: 99.99994267%; Prob(chance): 5.733031e-07"
So, 5σ corresponds to slightly more than 99.9999% of the area under in the bell curve; the total area being 100%.
It also corresponds closely to six 9s availability.
The last number is the probability that you happened to achieve that availability by random luck or pure chance.
A reasonable mnemonic for some of these values is:
- 3σ corresponds roughly to a probability of 1 in 1,000 that four 9s availability occurred by chance.
- 5σ is roughly a 1 in a million chance, which is the same as flipping a fair coin and getting 20 heads in a row.
- 6σ is roughly a 1 in a billion chance.
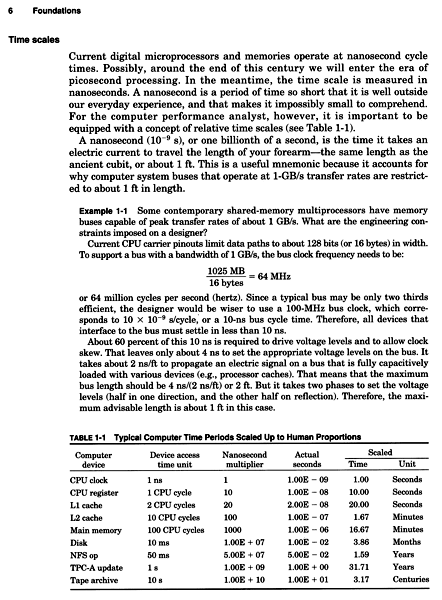
1.36 Timescale Intuition
 |
|
Because of the great diversity of timescales that exist in modern computer systems, it's a good idea to try and get
a more intuitive feel for some of them.
My first attempt at helping you to do that was in 1998, where I included the table shown at the left in
The Practical Performance Analyst.
I updated that original as Table 3.1 in my Perl PDQ book.
To keep up with the rapid changes in computer technology, I've recalculated the original table as an R data frame:
            Device         Real.ns Real.sec Scaled.time      Unit
1      1 GHz clock            1.00  1.0e-09        1.00    second
2  4 GHz CPU cycle            0.25  2.5e-10        0.25   seconds
3  L1 cache access            2.00  2.0e-09        2.00   seconds
4  L2 cache access            4.00  4.0e-09        4.00   seconds
5      Mutex locks           18.00  1.8e-08       18.00   seconds
6    RAM reference          120.00  1.2e-07        2.00   minutes
7       SSD access       150000.00  1.5e-04        1.74      days
8        HD access     10000000.00  1.0e-02        3.80    months
9     USA-AUS ping    160000000.00  1.6e-01        5.07     years
10      SQL update    800000000.00  8.0e-01       25.35     years
11    Tape archive  10000000000.00  1.0e+01        3.17 centuries
12     EC2 spin up 300000000000.00  3.0e+02        9.51 millennia
The first line shows how a 1 nanosecond clock period is scaled up to match a more human time of 1 second.
In other words, a multiplier of a gigasecond has been applied to the actual times to make them more human scale.
The last column shows the rescaled time unit ranging from seconds to millennia.
The key point is that since a modern core processor operates on the timescale of a fraction of a nanosecond in the real world
or ``seconds'' on the rescaled human scale, RAM accesses are seen to take on the order of minutes, disk accesses take on the order of a month,
database accesses take years, magnetic-tape IOs take on the order of centuries, while spinning up a cloud-based VM can take millennia.
Looked at from the standpoint of a core processor, tha above view gives a different slant to the expression: Hurry up and wait!
|
1.37 Throughput vs. Latency
The conventional wisdom that bandwidth and latency are independent metrics is
wrong or, at the very least, misleading. The standard example offered is flow through a pipe:
- Bandwidth (or throughput) corresponds to the diameter of the pipe.
- Latency corresponds to the length of the pipe (implicit time to flow through it at a constant rate).
Since each of these dimensions can be varied independently of one another, so the argument goes, throughput and latency
are independent metrics.
In performance analysis, however, these two dimensions are not only related, they are related nonlinearly by
Little's law.
Like the earth, the world of performance is also curved, not flat.
On closer scrutiny, one finds many problems with the conventional wisdom:
- Bandwidth and latency are ill-defined terms.
- Latency refers to some kind of (heavily context-dependent) delay, e.g.,
disk latency means something completely different from packet latency.
- Queueing theory is very specific about different latencies: waiting time, service time, response time, etc.
- Bandwidth usually refers to a special case of throughput, i.e., maximum throughput.
- Throughput and latency only appear to be unrelated in clocked systems; like flow through a pipe (see above).
- If you apply the conventional wisdom to database performance, for example, you will be surprised to find that
latency (e.g., response time) increases with throughput.
Using the "flat" approximation between throughput and latency
may be appropriate for certain systems, as long as the more global truth doesn't go unrecognized.
See my blog for a deeper discussion of this topic:
-
Bandwidth and Latency are Related Like Overclocked Chocolates
-
Bandwidth vs. Latency - The World is Curved
-
Little's law is a curved surface in 3-D
1.38 The Zeroth Performance Metric
Time is the zeroth performance metric.
See Chap. 3 of
Analyzing Computer System Performance with Perl::PDQ.
1.39 Only Three Performance Metric
There are only three performance metrics:
- TIME
Example metrics: waiting time (e.g., Oracle DB), latency
Example Units: cpu-ticks, milliseconds
- COUNT
Example metrics: runqueue length, packets dropped, RSS
Example Units: packets, pages, connections
- RATE
Example metrics: throughput, bandwidth
Example Units: MIPS, Gbps, GHz
More accurately stated, there are only three classes of metrics.
Every performance metric has to fall into one of these three classes or something is wrong.
Of these, TIME metrics are the basis of all performance measurement and analysis.
See mantra 1.38.
1.40 IT is the Manufacturing Line of the 21st Century
Historically, performance analysis has borrowed many concepts from
manufacturing efficiency, going all the way back to
the original performance analyst, Frederick Winslow-Taylor, who summed up his
efficiency techniques in his book
The Principles of Scientific Management in 1911, and
Henry Ford's assembly line in 1913.
Today, IT is the manufacturing line of the 21st century. †
Therefore, IT performance now plays a
dominant role in determining the financial performance of any company.
† Presumably, DevOps are the equivalent of assembly-line workers. :-)
1.41 Uncommon Sense
Common sense is the pitfall of performance analysis. ‡
‡ Appeared as the epigram in the 1st edition of my
Perl::PDQ book.
1.42 Don't Tell Stories
These days, especially on social media, it's very common to see so-called thought leaders
exhorting you to "tell a story" when giving a presentation.
Their intention is to boost your confidence but telling stories can be a slippery slope.
When I was in school, "telling stories" was a euphemism for lying!
Story telling focuses on the wrong aspect of a presentation: especially in a technical talk where
you're presenting performance analysis or some kind of engineering results.
Your main objective should always be accuracy of your thought processes, not the story.
On the other hand, there's no point in being accurate if no one is listening to you.
So, you do want to keep your audience engaged.
In the communications business, it's called a hook.
You want your content to keep your audience hooked.
Naturally, threading your content with a narrative is a good way to keep your audience engaged.
Your narrative can take different forms.
It could be a personal perspective showing how you, in particular,
arrived at your results, e.g., "I suddenly realized the server was not connected to the network. *#$%^&*!".
Or, it could be a special kind of story: a war story, that explains how
you had to battle your way to success.
In other words, providing the human-interest background that is otherwise never seen in
a conference paper or a journal article is almost guaranteed to keep your audience rivited.
But that should never translate into the story being more important than
the facts you want to communicate.
An excellent example of the slow descent into story-telling hell can be heard in
this podcast.
Listen for the key statement: "This is not science. It is storytelling."
To the degree that you do not make the accuracy of your content more important than story telling,
you diminish your credibility in the eyes of the audience.
P.S. Fewer cat pictures and more technical detail is always a better hook.
1.43 Performance is Not Engineering
Performance analysis is not an engineering activity.
Performance analysis should cover soup to nuts: from engineering (both software and hardware development),
to technical marketing, sales support, and customer satisfaction.
In other words, everything from the lowest level bits in multicore registers to
the highest level response time metrics of a customer's business application.
Conversely, data collected from these sources should be fed back into future product design.
To paraphrase the subtitle of my
PPA book,
this is how to achieve performance by design, not just post facto performance improvements.
Performance analysis requires broad system knowledge, mathematical analysis, collateral writing abilities, and
presentation skills. The most important skill, however, is knowing what details to ignore, i.e., the
opposite of an engineering skill. Every company should have a performance analyst (if you can find one).
1.44 It's Only Words
"It's only words and words are all I have"
—The Bee Gees
Words are extremely important in the process of performance analysis.
They are language tags for our mental concepts.
If you use vague words, your understanding is likely to remain vague.
An example of a poor performance word is, latency.
For reasons known only to those who use it, the term "latency" has become regurgitated ad nauseam.
In performance analysis it is a useless generic word.
Successful performance analysis requires that such words immediately be decomposed into more useful metrics,
such as, service time, waiting time or round-trip time.
Latency is just a more pretentious word for delay.
So, peculiar declarations like, "Latency fanatic!" that are often seen in Twitter bios, just mean you are a fan of delay:
less time rather than more time, presumably.
That's good because time is the ZEROTH performance metric. See Chapter 3 of
Analyzing Computer System Performance with Perl::PDQ.
All that notwithstanding, what people really care about is what you've done to reduce that latency.
2 PERFORMANCE MODELING RULES OF THUMB
Here are some ideas that might be of help when you're trying to
construct your capacity planning or performance analysis models.
2.1 What is Performance Modeling?
All modeling is programming and all programming is debugging.
Similarly seen on Twitter:
"90% of coding is debugging. The other 10% is writing bugs."
2.2 Monitoring vs. Modeling
The difference between performance modeling and performance monitoring
is like the difference between weather prediction and simply watching a weather-vane twist in the wind.
The latter is analogous to the time series seen in most graphical data displays.
As a general matter, our brains are not structured to cognitively process time-series data so, those data
need to be transformed into a representation that is more amenable for our brains to analyze. Performance models fulfill
the role of data transformers.
2.3 Keep It Simple
Nothing like jumping into the pool at the deep end. Just don't forget your swimming togs in the excitement.
To paraphrase Einstein:
A performance model should be as simple as possible, but no simpler!
Someone else said:
"A designer knows that he has achieved perfection not when there is nothing left to add, but when
there is nothing left to take away." —Antoine de Saint-Exupéry
I now tell people in my
Guerrilla classes,
despite the fact that I repeat this rule of thumb several times, you will
throw the kitchen sink into your performance models; at least, early on as you
first learn how to create them. It's
almost axiomatic: the more you know about the system architecture, the
more detail you will try to throw into the model. The goal, in fact, is the
opposite.
2.4 More Like The Map Than The Metro
A computer performance model is more like the
map of a metro than the metro itself.
The metro map is an abstraction that has very little to do with the
physical railway. It encodes only sufficient detail to enable
transit on the rail system from point A to point B. It does not include
a lot of irrelevant details, such as, whether or not
the stations are above or below ground, or even
their actual geographical proximity. A performance model is a similar kind of abstraction.
In fact, the analogy is even stronger than you might think.
The metro map represents a the rail network. Similarly, all computer systems, from
a mobile phone to the largest web site, are essentially a network of buffers. The buffers hold
requests that are waiting to be serviced by shared computational resources.
Since buffers are queues, all computer systems can be represented as
a network of queues (that can be solved with
PDQ).
And that's one way to construct and solve a performance model.
2.5 The Big Picture
Unlike most aspects of computer technology, performance modeling is
about deciding how much detail can be ignored!
2.6 A Point of Principle
When constructing a performance model of a computer system, e.g., statistical or queueing,
look for the principle of operation or POp. A POp should be simple and relatively
easy to state.
If you can't describe such a principle of operation in 25 words or less, you probably don't have it yet.
As an example consider a classic multi-user time-share OS, like Unix or Linux.
Its POp can be stated as follows:
Time-share scheduling gives every user the illusion that they are the only user on the system.
[17 words]
All the millions of lines of code inside the OS that implement time-slicing,
priority queueing, etc., are there merely to support that POp.
The overall performance goal is to minimize the user response-time metric.
Being able to see things in this unconventional way can really help in the deciding on the
simplest kind of performance model.
As Steve says: "Simple can be harder than complex."

Now that you get the idea, here are a couple of questions for you to ponder:
- Your laptop is also a time-share OS, e.g., Mac OS X, Ubuntu Linux, Windows.
Is the PoP for that single-user OS the same or different than it is for a multi-user OS?
- Virtualization environments, like VMware or Parallels hypervisors are all the rage,
but these hypervisors are nothing more than a kind of global OS with each time-share OS
treated as an embedded guest OS.
Is the hypervisor PoP the same or different than it is for a time-share OS?
See Chapter 7 of the GCaP book
for more information related to these questions.
2.7 Guilt is Golden
Performance modeling is also about spreading the guilt around.
You, as the performance analyst or planner, only have to shine the
light in the right place and then stand back while others flock to fix it.
2.8 What is a Queue?
From a computer architecture and performance analysis standpoint, you can think of a queue as a buffer.
Sizing the buffer is often associated with meeting performance and capacity requirements.
From a queue-theoretic standpoint, a buffer can be thought of as having either a fixed capacity (the usual case in reality)
or an unbounded but not infinite capacity. The latter is very important
for finding out what buffer size you really need, rather than what buffer size you think you need.
- A queue is a line of customers waiting to be severed—as in
"
Off with their heads!" (*)
-
Hardware version: A queue is implemented as a register,
e.g., a memory register.
-
Software version: A queue is implemented as a list.
In some computer languages it is a separate data type, e.g., Lisp, Mathematica, Perl, etc.
(*) I did mistakenly write "severed" while discussing queues during a Guerrilla class in November, 2002.
In Chapter 2 Getting the Jump on Queueing and Appendix B A Short History of Buffers
of my Perl::PDQ book,
I point out that a queue is a very appropriate paradigm for understanding the performance of
computer systems because it corresponds to a
data buffer.
Since all digital computer and network systems can be considered as a collection of buffers,
their performance can be modeled as a collection of queues, aka: queueing network models, where the word
"network" here means circuit; like an electric circuit.
PDQ (Pretty Damn Quick)
helps you to sever computer systems with queues.
Queueing theory is a relatively young science, having just
turned 100 in 2009.
2.9 Where to Start?
Why not have fun with blocks—functional blocks!
One place to start constructing a PDQ model is by drawing a
functional block diagram. The objective is to identify where time
is spent at each stage in processing the workload of interest.
Ultimately, each functional block is converted to a queueing subsystem
like those shown above. This includes the ability to distinguish
sequential and parallel processing. Other diagrammatic techniques e.g.,
UML diagrams, may also be useful but I don't understand that stuff and never tried it.
See Chap. 6
"Pretty Damn Quick(PDQ) - A Slow Introduction" of
Analyzing Computer System Performance with Perl::PDQ.
2.10 Inputs and Outputs
When defining performance models (especially queueing models), it helps
to write down a list of INPUTS (measurements or estimates that are used
to parameterize the model) and OUTPUTS (numbers that are generated by
calculating the model).
Take Little's law Q = X R for example. It is a performance model;
albeit a simple equation or operational law, but a model nonetheless. All the
variables on the RIGHT side of the equation (X and R) are INPUTS, and
the single variable on the LEFT is the OUTPUT.
A more detailed discussion of this point is presented in Chap. 6
"Pretty Damn Quick(PDQ) - A Slow Introduction" of
Analyzing Computer System Performance with Perl::PDQ.
2.11 No Service, No Queues
You know the restaurant rule: "No shoes, no service!"
Well, the complementary PDQ rule is:
No service, no queues!
By definition, a queue consists of a buffer or waiting line and a service facility with an associated service time.
If you can't provide a numerical service time value as an argument to the PDQ function,
SetDemand(), then you can't define that queue
as a PDQ node in your performance model:
irrespective of shoulda-coulda-woulda or how much you really, really, want it to be there.
What this usually boils down to is, rethinking what it is that you're trying to model. See Section 2.12 for possible ways to estimate service times.
2.12 Estimating Service Times
Service times are notoriously difficult to measure directly. Often,
however, the service time can be estimated from other performance
metrics that are more readily available.
Suppose, for example, you had requests coming into an HTTP server
and you could measure its CPU utilization with some tool like Unix/Linux
vmstat, and you would like to know the service time of the HTTP Gets.
Unix won't tell you directly, but you can use Little's law (U = X S) to estimate it.
If you can measure the arrival rate of requests in Gets/sec
(X) and the CPU %utilization (U), then the average service time
(S) for a Get is easily calculated from the ratio U/X.
Another approach is to simply make a guess about the actual service time.
Then, you will need to decide which other measured metric you are going to use to compare and validate your guess for the service time.
You might, e.g., use the queue length (which is another PDQ output) to validate your guess.
2.13 Change the Data
If the performance data don't support your
performance model,
change the data.
This may come as a surprise but, many performance measurements are either wrong (not calculated correctly at the source) or are inconsistent
with other performance metrics. The best way to verify that is to apply the appropriate performance model to verify measurement consistency.
2.14 Closed or Open Queue?
When trying to figure out which queueing model to apply, ask
yourself if you have a finite number of requests to service or not. If
the answer is yes (as it would be for a load-test platform), then it's a
closed queueing model. Otherwise use an open queueing model.
2.15 Opening a Closed Queue
How do I determine when a closed queueing model can be
replaced by an open model?
This important question arises, for example, when you want
to extrapolate performance predictions for an Internet application (open)
that are based on measurements from a load-test platform (closed).
An open queueing model
assumes an infinite population of requesters initiating requests at
an arrival rate λ (lambda). In a closed model, λ (lambda)
is approximated by the ratio N/Z.
Treat the thinktime Z as a free parameter, and choose a value (by
trial and error) that keeps N/Z constant as you make N larger in
your PDQ model. Eventually, at some value of N, the OUTPUTS of both the
closed and open models will agree to some reasonable approximation.
2.16 Steady-State Measurements
The steady-state measurement period should on the order of 100 times
larger than the largest service time.
2.17 Transcribing Data
Use the timebase of your measurement tools. If it reports in seconds,
use seconds, if it reports in microseconds, use microseconds. The point
being, it's easier to check the digits directly for any transcription
errors. Of course, the units of ALL numbers should be normalized before
doing any arithmetic.
2.18 Workloads Come in Threes
In a mixed workload model (multi-class streams in PDQ), avoid using more
than 3 concurrent workstreams whenever possible.
Apart from making an unwieldy PDQ report to read, generally you are
only interested in the interaction of 2 workloads (pairwise comparison).
Everything else goes in the third (AKA "the background"). If you can't
see how to do this, you're probably not ready to create the PDQ model.
2.19 Better Than a Crystal Ball
A performance model is not clairvoyant, but it's better than a crystal ball; which is just a worthless piece of glass.
Predicting the future is not the same thing as "seeing" the future.
A performance model is just a means for evaluating the data that are provided to it. The purpose of the model
is to transform those data into information. The amount of information that can be
extracted is intimately dependent on the values of those data. Change
the input data and you change the output information. An oft-quoted example is: garbage in, garbage out.
That's an extreme example. More commonly, you may see unexpected modeling results.
In that case, the new data do not
meet the expectations set by the prior measurements. But that doesn't
necessarily imply the model is wrong. More likely something has changed in
the measurement system so that it has failed to remain consistent with the initial
information contained in the previous measurements.
Having a performance model forces you to ask why that unexpected change has
occurred and can anything be done to remove it. Without a performance
model, you don't have any expectations or context for asking such questions.
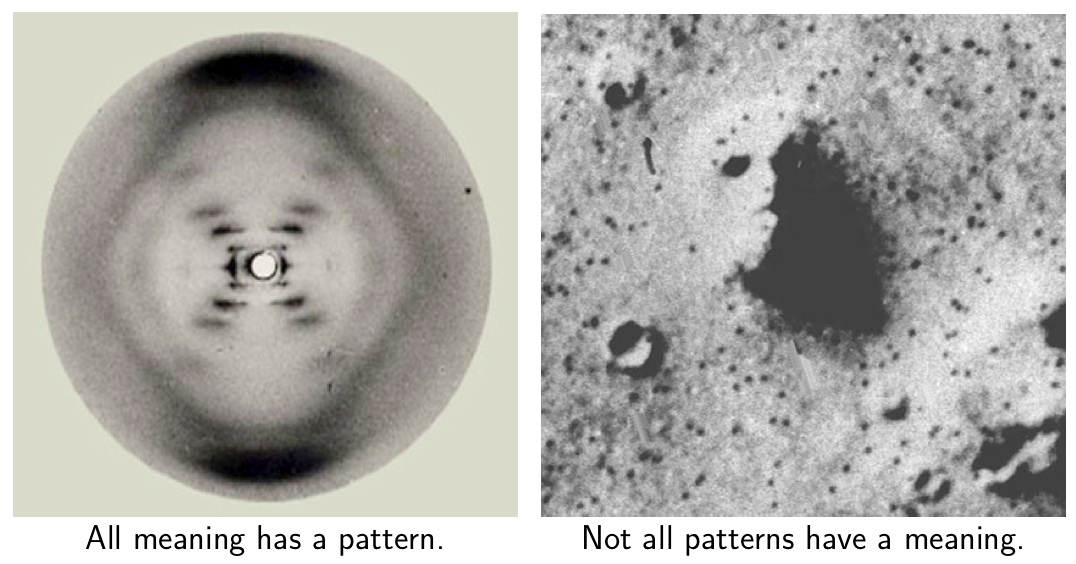
2.20 Patterns and Anti-Patterns
All meaning has a pattern, but not all patterns have a meaning.
Your brain will eat patterns before it realizes it just choked. —njg (2020)
- Visual example:
-
- Textual example:
-
Colorless green ideas sleep furiously. —N. Chomsky (1957)
Your neural compiler happily accepts the correct syntax (pattern) but crashes on the semantics (meaning).
The technical term is
Apophenia,
which is the experience of seeing patterns or connections in random or meaningless entities.
New research indicates that if a person is not in control of the situation,
they are more likely to see patterns where none exist, suffer illusions and believe
in conspiracy theories.
In the context of computer performance analysis, the same conclusion might well apply when
looking at data
collected from a system that you don't understand.
2.21 Interpreting Data
Performance modeling can often be more important for interpreting data than predicting it.
The conventional view of performance models is that they are useful for:
- Predicting the future performance of an extant system
- Exploring what-if scenarios that may or may not be realistic
A performance model can also be used for interpreting performance measurements.
Both the measurements and the model must be consistent or something is wrong and needs to be explained.
2.22 Intuition and Modeling
Intuition is a seductive siren who will let you crash on the coast of confusion so, better to tie yourself to the mast of mathematics.
Ulysses is the Greek hero in Homer's Odyssey. On their way back from
the Trojan wars, Ulysses orders his men to plug their ears so that they won't
succumb to the beautiful song of the sirens and kill them all in a shipwreck.
Ulysses, being a typical manager, chooses not to plug his ears because he can't
bear the idea of NOT hearing the sirens' singing. So, he orders his men to tie
him to the mast
of their ship. Such a guy!
2.23 Load Average
The load average in UNIX and Linux is not your average kind of average.
It's actually an exponentially damped moving average (EMA) of the type commonly used in data smoothing.
More especially from the standpoint of performance analysis and capacity planning,
it's the EMA of the O/S run-queue size.
Although it can be useful to know the load average, it's rather limited in value because it's an absolute metric.
For the purposes of comparison, it's even better to know a relative metric like the stretch factor,
which is related to the load average. See item 4 below.
For a more complete discussion, see:
- See Chapter 4 in 1st edn. of the
Perl::PDQ book.
- See Chapter 6 in 2nd edn. of the Perl::PDQ book.
- Read the original online articles (as PDFs):
a. How the Load Average Works
b. Not Your Average Average
c. Addendum on Hz versus HZ
- How to convert the absolute load average to the relative
stretch factor metric.
2.24 VAMOOS Your Data Angst
It's easy to get carried away and jump the gun trying to model your Perf or CaP data ... and get it wrong. :/
Instead, try to follow these basic VAMOOS steps:
- Visualize:
Make a plot of your data without making any assumptions about how it should look.
This is where tools like scatter plots come in.
- Analyze:
Look for patterns or other significant features in the data and possibly quantify them, e.g.,
trends in the distribution of data points or periodically repeating features, such as spikes or peaks.
- Modelize: Consider different types of models, including:
SWAG,
statistical regression, queue-theoretic, simulation, etc. If you are using the
Chart>Add Trendline feature in Excel, this is where you choose your model from the Excel dialog box.
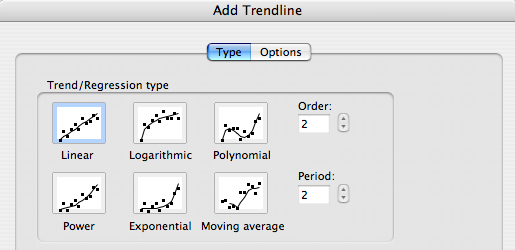
Don't fret over whether or not it's the "right" choice: there's no such thing, at this point.
Whatever your choice, try to make it consistent with steps 1 and 2. If it doesn't work out it doesn't matter because,
based on the next step, you're about to come around again. :)
- Over and Over: None of this is likely to converge in a single pass.
- Satisfied: Iterate your way to success. Repeat until you are satisfied that all your assumptions are consistent.
In other words,
VAMOOS stands for Visualize, Analyze, Modelize, Over and Over until Satisfied.
2.25 All Measurements are Wrong
All measurements are wrong by
definition.
Measurements are expressed using numbers, but measurement is not the same as mathematics.
Mathematical numbers involve exact quantities like, the
prime numbers.
The primes are exact by definition. The number 11 is provably a prime number. Exactly.
It's not approximately a prime number.
Numbers that are produced by measurement are the result of a comparison process
between a measurement device with a numerical scale and the thing being measured.
The process of measuring with that device inevitably introduces indeterminate effects or sources of noise.
There is no noise in mathematics.
The measurement process, e.g., aligning a straight-edge scale to indicate where to cut a piece of wood,
always involves influences that are not completely controllable.
These uncontrollable influences mean that any measurement cannot be repeated exactly.
That lack of determinism or noise is expressed as measurement error.
The error in a set of repeated measurements of the same thing (technically known
as samples) is commonly represented as the deviation above and below the average
of the set of measurements.
|
measured number = average ± error |
| (3) |
Due to the presence of error, measured results can only ever be an approximation.
And although there are some very sophisticated techniques to help in reducing the effect of various noise sources,
noise can never be eliminated completely.
This limitation is just as true for electronic measurements in computer systems (e.g., performance metrics) as it is for
measuring a piece of wood.
Moreover, measurements can never produce exact numbers (like prime numbers) despite
commonly seeing measured values displayed as though they were exact numbers, e.g., CPU% = 23.
That is a misrepresentation. More on that shortly.
In that sense, measured numbers look more like the mathematical representation of irrational numbers, e.g., π.
By definition, π = C/D is the ratio of the circumference of a circle C to its diameter D.
We can think of the diameter as being like a ruler or tape measure where the ratio C/D is like asking, how many diameters there are
in the circumference? One possible result is the ratio 3/1, i.e., there are 3 diameters in the circumference.
But you already know that the exact number 3 is less than the value of π.
If the circumference was π meters long,
there would be a small gap remaining after you stepped your meter-ruler three times along the circumference.
On the other hand, you might be willing to accept π = 3 as a rough approximation, and live with the gap, depending on how you
plan to use that value. For example, it might be good enough to do a quick calculation in your head.
Successively better approximations could involve ratios like: 7/2, 22/7, 333/106, 355/113.
These ratios are analogous to reading off graduation marks on your ruler to improve the precision of your measurement.
But none of these ratios or fractions are exactly equal to π.
That's why π is declared to be ir-ratio-nal: unable to be written exactly as a ratio of whole numbers.
Nor is a more familiar number, like 3.1415926, any better. That's just a decimal representation that approximates the
exact quantity, π.
The more important question is, how good is the approximation. Or, in the case of
measured numbers is, how big is the error? Another question is, can you tolerate the amount of error?
If not, what are you going to do about it? For example, can you improve on the current
measurement apparatus or procedure?
The difference between the approximation for π and physical measurement is that
the digits of the former can be calculated to
any degree of precision
at will,
whereas measurement digits are unpredictable and therefore remain completely unknown until many measurements are made
at the desired level of precision, and expressed using equation 3.
You'll never see a statement like, π = 3.14159 ± 0.000001, in math.
It's something of an indictment that no performance measurement tools display errors.
The omission of error representation leads people to believe that a displayed number, like 23% CPU busy,
is the same number as the
9th prime number.
Since all performance metrics are measured (indeed, those two words have the same root word), it
should really be displayed using equation (3),
e.g., CPU% = 23 ± 2,
to remind us that there is always error or "wrongness" in the measurement.
2.26 Modeling Errors
All performance models are wrong, but some are wronger than others.
Predicting the future is not the same thing as "seeing" the future, in the sense of seeing what things
might look like.
See GMantra 2.19 for more on this point.
All predictions are merely estimates based on (input) data (or other estimates)
and therefore predictions come with errors. The only real question is, how much error can you tolerate?
2.27 Data Ain't Information
Data is not (are not) the same thing as information.
A Google search returns a lot of data, not information. Google admits that:
Are you feeling lucky?
It should be a certainty, but it's not.
Sneakily, Google also knows that your brain will quickly decide what is information in all those links,
such that you don't even realize you're doing most of the work which you unconsciously attribute to Google.
They know
your brain craves patterns.
Collecting performance data is only one half the story: rather like a Google search. You still have to decide
what information (if any) is contained in all those data.
Unlike a Google search, however, performance data are not simple text (simple for your brain, that is).
Performance data usually come in the form of a torrent of numbers which, unlike text, are not simple for your brain to comprehend.
Even worse, without doing the proper analysis, the data can be deceptive and lead you to the wrong conclusion.
That's where performance analysis tools and models come in. They act as
transformers on the data to help your
brain decide what is information.
2.28 Text is the Universal API
In the colophon of my GCaP book, I ask:
Why do I use LaTeX? [Because] It takes flat ASCII text† as its typographic source.
Flat ASCII is both a universal program interface‡ and an immutable data repository.
The same could be said for my "no GUI" philosophy regarding
PDQ.
† By flat ASCII I mean text that is devoid of any particular formatting or special encoding
that might prevent it from being read in the future by tools that were not used to write it.
Unlike Unix mail, for example, Microsoft Outlook encodes its email text in a proprietary
binary format that is not legacy compatible.
‡
This is aligned with an important tenet of
UNIX philosophy
(c.1978) due to Doug McIlroy, the inventor of UNIX pipes, viz., write programs to handle text
streams, because text is a universal programmatic interface.
2.29 Play It Where It Lies
The expression, "Play it as it lays", comes from a golfing rule that arose while the game
was originally being developed in Scotland.
When golf was later introduced to the USA, the less archaic form of english became
"Play it as it lies" or
"Play it where it lies".
It means golfers must take their next shot without touching their ball after it has
finally come to rest. They must play the ball as it is.
Similarly, in performance analysis, we don't always find performance data residing where we
expect it.
Nor do we always find it to be how we expect it to appear.
The data, or performance information, might not be recorded in a readable text format.
It might not be presented graphically, either.
Moreover, it might not be possible to transform the data into any of those more convenient forms.
In other words, like a golfer, we must "play" (assess) the data where it lies, just as it is.
Vital performance data does not always come from your favorite performance monitoring tools.
Sometimes it comes from wildly unexpected places. In my
Guerrilla Capacity Planning class
I tell a war story that occurred in the wee hours of one very anxious night.
Some database performance engineers were frustrated trying to increase the throughput
on a $5 million customer-evaluation platform and getting nowhere with their GUI-based performance tools.
A successful sale, the next day, depended on maximizing customer throughput.
 Although I was on the scene, I had run out of constructive suggestions.
In a fit of bordom I wandered outside and into the building where the evaluation machine was housed.
In the darkness, I noticed the status LEDs on certain controller boards were sporadically pulsating in synchrony—a highly undesirable situation.
I ran back and reported my observation to the performance engineers.
Immediately, the proverbial light-bulb lit up in someone's head and after a brief time spent resetting with the DBMS parameters,
throughput performance dramatically increased with each new test.
Without my observational data, and their correct interpretation of it, we would still have been groping in the dark at the crack of dawn.
Although I was on the scene, I had run out of constructive suggestions.
In a fit of bordom I wandered outside and into the building where the evaluation machine was housed.
In the darkness, I noticed the status LEDs on certain controller boards were sporadically pulsating in synchrony—a highly undesirable situation.
I ran back and reported my observation to the performance engineers.
Immediately, the proverbial light-bulb lit up in someone's head and after a brief time spent resetting with the DBMS parameters,
throughput performance dramatically increased with each new test.
Without my observational data, and their correct interpretation of it, we would still have been groping in the dark at the crack of dawn.
2.30 Data is Not Enough
You need to compare measured data with a model,
e.g., USL,
PDQ:
- To check data consistency
- To explain those data
- Data + Models == Insight
How else can you know if you're wrong!?
2.31 Plans Are Useless
"In preparing for battle I have always found that plans are useless, but planning is indispensable." —Dwight D. Eisenhower
The real value of doing capacity planning often comes from starting the planning process itself,
rather than achieving the final plan.
2.32 Benchmark Design
The design of a good computer-system benchmark is an extremely difficult undertaking.
That's why professional organizations like
SPEC.org (CPU and applications)
and
TPC.org (databases)
take years to roll out a new benchmark specfication.
Quite apart from all the nitty gritty details about what the benchmark is and what it does,
it's important to keep the following simple concepts uppermost in your mind:
- All computer benchmarks are workload simulations
- Such simulations involve two essential components: stimulus + response
- The stimulus = workload generator
- The response = performance of system under test (SUT)
Any meaningful discussion about benchmarks must include BOTH these components.
2.33 Waiting Time
When you're enqueued at the grocery store or wherever:
Theorem (Gunther 2019): Thinking about queueing theory exponentially reduces waiting time.
Proof: Try it. ▢
2.34 Statistics
It bothers me when people say or imply that AVERAGES are no good or misleading.
It demonstrates a lack of understanding about what statistics is and how it works.
That's not too surprising because statistics is actually a very unintuitive subject.
And, to make matters worse, it's often taught very badly,
which is why I created my
GDAT course.
Here are some things to keep in mind about statistics:
- Statistics is an attempt to make formal statements about uncertainty.
- Statistics is not mathematics.
- Statistics has been in development for about 500 years. It mostly started with attempts to predict the odds of
winning at gambling games. (some things never change)
- It's not over yet. Witness the ongoing historical battle between Bayesianistas (who came first c.1760s)
and the Frequentists (Fisher et al. c.1930s).
- We won't mention that Fisher's formal p-values are now considered to be unreliable or that Bayesian statistics is
now the foundation of so-called Maching Learning algorithms.
- The very small probability of you winning the lottery or getting a fatal disease is a statistical statement about likelihood
because the actual state is unknown or uncertain.
Once you win the lottery or become ill, you are no longer a statistic, in the sense that you know your state with
100% certainty. If you are the statistic, then it's not statistics.
- It has sometimes been said (even by professional perf analysts) that PDQ is not very useful because it only
computes averages.
- Averages are VERY important. Most people/users haven't got a clue about the average value of the KPI they're
interested in. Often because it hasn't been measured.
I once asked the CEO of Hyatt Hotels what was his average daily transaction rate. He had no idea.
- Those involved with application (performance) monitoring tend to think that
percentiles are more important than statistics or probabilities.
What they don't realize is, percentiles (or quantiles, more technically) are just ranked data and
ranked data is logically equivalent of the
CDF,
which is the formal statistical expression of probabilities. :)
- The notion that variance is a more important than the average,
because it can quantify peaks and outliers, is a false dichotomy.
Variance is defined in terms of the average value (the statistical mean).
It quantifies the variation with respect to the mean. So, you need to know the mean value, anyway.
- The mean and the variance (or standard deviation) are respectively related to the first and second moments
of the underlying distribution—which you most likely don't know and never will know.
2.35 Realistic Models
What is reality?

Reality Beach
- Don't be too concerned about reality. It's just an annoyance that refuses to conform to your performance models.
- Never let reality get in the way of a good performance model.
2.36 Models as Explanations
Practical performance modeling is often more about finding plausible explanations
for the data than it is about making predictions based on those data.
3 UNIVERSAL SCALABILITY LAW (USL)
This section has grown to the point where it now has its
own page
updated with all the most recent developments.